




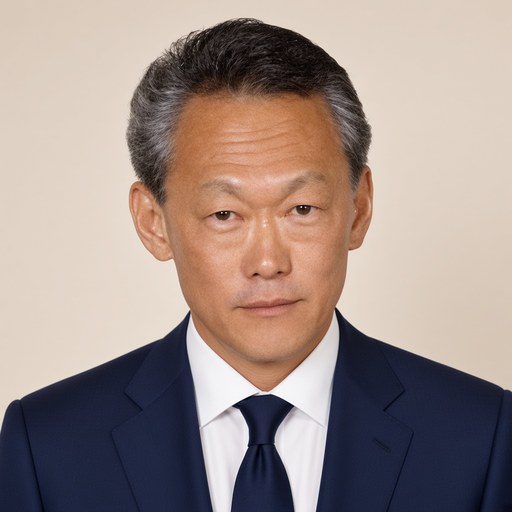
Address By The Prime Minister, Mr. Lee Kuan Yew, To Members Of The Political Association Of The University Of Singapore On "Higher Education And Singapore'S Future" On 23 December 1977
 Lee Kuan Yew · Prime Minister of Singapore
- Context
- Lee addressed members of the Political Association of the University of Singapore on December 23, 1977, on higher education and Singapore's future, defending selective enrolment, bilingual education and reliance on foreign professionals, and welcoming Nanyang University's move to English.
- Main themes
- Graduate unemployment, university enrolment policy, wastage in primary education, bilingual education and the PSLE, employment pass holders and Singaporeanisation, dependence on foreign professionals, English as a neutral language, Nanyang University's switch to English instruction, national service and education feedback, graduates' commitment to the community, falling births and smaller classes, comparison of tertiary enrolment with Britain, Japan and America
- Duration
- ~27 min
- Words
- 3,195
- Sentences
- 196
- Readability
- 60
- Grade
- 8.6
- Syntax
- 2.71
- Vocabulary
- 2.56
Source: National Archives of Singapore ↗
The broad sphere of national life a sentence belongs to. Every sentence has an Arena, so it is the denominator the other indices are read against.
Other196 sentences in 87 paragraphs
Since I last spoke in this lecture theatre, the temper and composition of the university has changed. First, nearly all the male students have now done 2.5 years National Service – older, I hope wiser. Second, the prospect is of a less buoyant employment market for graduates. I believe the mood is more sober and less boisterous.
One way to keep a population on its toes is high unemployment, a salutary method of social discipline.
We have been fortunate, particularly in not having had significant unemployment in the years since the oil crisis. Therefore, social discipline and work discipline have to be achieved by other means – management controls, cultural habits and social pressure.
lky/1977/lky1223a.doc
From Labour Ministry statistics, graduate unemployment is zero. By not having been born earlier to catch the economic boom before October 1973, what you will miss is the prospect of rapid promotions and increments.
For any government, high graduate unemployment is one of the key indicators of political disorder. The more trained and educated people a country has who are unemployed, the greater the potential for social and political unrest.
Therefore, oil producing countries who have come into fabulous wealth since 1973, have been cautious – having seen what has happened in India, in Pakistan, in Ceylon – in substantially and rapidly increasing students who go to universities.
Our graduate unemployment rate is zero for two reasons. First, rapid economic development. Second, a university enrolment policy that ensures that only those who are clear potential passes are admitted and that the pass standard is never lowered.
We have from 1970 to 1977 between 7-9% of those who made Secondary
1 going to university (Table 1). This compares with 9.5% (Table 2) for England and Wales. However, if we take the percentage on the base of entrance into Primary 1, then although for England and Wales the figure is still 9.5% for lky/1977/lky1223a.doc
Singapore, the figures range from 4-5%. The reason is that some 35-40% of Primary 1 students did not pass the Primary School Leaving Examinations.
I hope, with the abolition of automatic promotions, we shall reduce the failure percentage rate to between 20-25%.
From 1970-75 in Japan, the figure was 31%. In America, 48%. These are not comparable figures because the Japanese and American education systems are different from ours which was built on the British norm. Japanese and American figures will include all those who made Pre-U 2 of our school system.
However, the Japanese percentage of 31% is impressive because a large slice of that figure is in technical education.
If we add our Polytechnic, Ngee Ann students to the percentage who make tertiary educated, against secondary one as the base, we have an additional 6-9%.
But placed against a primary one base, the figures go down between 4-5%.
For those in the apex of this pyramid, the universities, you may be reassured to know that we have in 1976 4,730 employment passes of professionals. Engineers are the largest group (2,552), next, teachers (1,191), then doctors and dentists (338), accountants (278), and architects (210). (Table lky/1977/lky1223a.doc
3). In addition, there are 920 university-trained who are on work permits. They are those starting their careers with salaries below $750. Again, the largest group is for engineering (188), and next science graduates (171), most probably as trainee teachers (Table 4).
A significant part of our economic growth has been contributed to by these professionals.
Another set of figures will give you an idea of the magnitude of the seats you will have to fill if we were to attempt a policy of Singaporeanisation. There are 15,155 employment pass holders and foreign investors. Together, they earned, in 1974, from the latest figures available, $420 million. This is income for themselves, not for the companies. It is from their income tax returns in Singapore. It does not include the arrangements they may have for incomes to be paid in, the Bahamas or Bermuda or other tax-free havens. Remove these 15,000 and I venture the guess that we have within 12 months about 300,000 unemployed (30% of our workforce). It will take 12 months because economic activity will go on until new decisions were not made, or wrong ones taken, and production and sales come to a halt.
lky/1977/lky1223a.doc
When we embarked energetically on this economic policy of global economic links after 1965, we did so with our eyes wide open. This economic strategy has linked us more closely and directly to the major centres of industrial strength – trade, manufacture, communications, finance, the lot. There is no way to embark on Singaporeanisation without irreparable damage. I do not see us producing the number of engineers, management consultants and decision- makers with the experience and judgement to fill these jobs, even if all the firms wanted us to, for at least 20 years. Before then, new advances in business and industry will bring in a new generation of experts and expertise. Therefore the urgent need is to get more of our students educated better, to cut down the wastage. We have to improve our education from kindergarten upwards to post-university training.
Our wastage rates are terrifying. In 1964, nearly 64,000 students entered primary one, the peak year. They were born in 1958. The PAP took office in 1959.
So I can disclaim responsibility. But the PAP was saddled with the burden. In 1977, the primary one admissions were down to 47,000. For 1976, and again in 1977, at least till a few days ago, we were below the 40,000 mark. Had we left population trends alone, we would have had shot beyond the 80,000 babies per annum mark by 1977. Then this great opportunity to transform the educational quality of the population would never have been.
lky/1977/lky1223a.doc
All these years, since 1959, we have just been mass producing schools and teachers, and juggling with languages of instruction. It was a messy, massive exercise as much in education as in politics. And it was and is highly sensitive politics because language and culture arouse great passions. The wastage is unbelievable. Can it be that we are more stupid than other people?
Each year, some 100 of our top scholars go abroad on scholarship.
Formerly, they were nearly all men. Now, there are gradually more women.
Nearly half, 50%, of these scholars each year are in the first class honours list of their universities, in Britain, Canada, Australia, New Zealand. Even those in Japan, France and Germany do very well, despite having to learn a new language.
Yet until last year, we could not get more than 55 or 60% to pass their
PSLE after six years of schooling at the first attempt. It was amazing. We should have had the feedback within the Education Ministry. We did not. The feedback came through only National Service. We discovered it when we had to get Hokkien-speaking platoons formed and to teach officers to speak Hokkien in order to command the men. Only then did the Education Ministry know what lky/1977/lky1223a.doc had gone wrong. Once a student misses language comprehension, he or she has missed the bus with automatic promotions.
When a Singapore child goes to school he is exposed to bilingualism, in
75% -- may be 72% of the cases – to two new alien languages. At home he speaks Hokkien, Hainanese, Teochew, Hakka, Cantonese, or Hindi, or Bengali – name the dialect and we have got it. He goes to school and is immediately confounded by a barrage of two verbal artillery systems. He is subjected to two percussion bangs. Into one ear he gets English, into the other Mandarin. He speaks neither at home. No two languages are more different and diverse.
Chinese is monosyllabic, tonal, idiographic, no phonetics, without inflexions, and a unique syntax. But after a while, he discovers how the sounds are related to his dialect at home.
But, the English his teacher speaks, he does not quite understand at all.
And when he is about to make sense out of it, he is further confused when he watches television. Between the Singapore announcer, “Hawaii Five-O”, “On the Buses”, the whole range of American, British, Australian accents, many a student gets lost. So he retreats into Hokkien, Singapore Hokkien, not Amoy standard Hokkien. He is what, if I were a doctor, I would call a linguistic “autistic” – he withdraws into himself, the patois of his home and his friends.
lky/1977/lky1223a.doc
Education is a very gradual process. We will not know our errors until some eight to ten years. And we will not see the success of corrective policies until another eight to ten years.
I would be surprised if we cannot reduce the PSLE wastage down to 25%.
But 25% is still very high. But this may be the price we have to pay to produce bilingualists. In most monolingual societies like America, the illiteracy rate is about 10%. But we cannot have monolingual education.
However, I am cheered by the drop in total births. With the number of teachers already recruited, classrooms will go down from 44 to about 30 pupils.
We can have more individual attention and correction of all compositions. We have too many gradings of compositions with no corrections of grammar and style. We have too many “tikam-tikam” multiple choice questions. Gradually, we shall have a population which will react instantaneously, laugh, cry, and be angry together at the same time. We will share a common language – nearly.
lky/1977/lky1223a.doc
But for your lifetimes, whether as a supervisor or an executive, you will be faced, and those of you who have done National Service know this well, with having to repeat your instructions in one other language besides English. And it is absolutely wrong that one other language should be a dialect.
It means that because of the structure of our society, for a long while, those who want to be effective in supervisory positions must be bilingual, preferably trilingual – a tremendous imposition. Every word, from “A” for apple has to be learned in three languages. That is the price we have to pay for at least another generation.
Because I learned my Mandarin and dialect in adult life, I have had to keep new phrases in practice so that they will roll trippingly off my tongue. So, I used to carry a multipurpose plug for my tape-recorder when I travel. When I get to a new destination, I had to adjust the plug pins. This will give me a clue on whether or not to change the voltage on the tape-recorder from 240 to 110.
But when I have to switch between English, Mandarin, Hokkien, and Malay – never mind Tamil, the mental transformers have even more work to do than the multipurpose plug. These transformers, physically and mentally, that I have to lug around are an encumbrance. Unfortunately, they are not excess luggage I can afford to jettison.
lky/1977/lky1223a.doc
My final point is that most of our acute problems are of a very special nature, and they can be solved only by those who understand the complexities of Singapore and Singaporeans. If most of this meagre 4% of Primary 1’s, who get to the top of the educational pyramid are without that sense of commitment to the community that carried them and paid for them to get up to the upper reaches of the education ladder, then Singapore will falter and fail.
Wastage there always will be. But a clear majority must have an abiding commitment to the joint interests of their fellow citizens and themselves or Singapore will fall apart into the disparate racial, clan, dialect and religious groups from whence they sprang. It is this sense of responsibility , this unavoidable obligation to keep the Singaporeans together, to protect their lives and livelihood, which cannot be imported. We can afford to import the professional expertise and entrepreneur flair in the 15,000 employment pass holders. But we cannot import this feel for Singapore, and what makes Singaporeans tick. Only we can do this for ourselves.
And one unpleasant decision which the University of Nanyang has taken, a most necessary decision, is that from 1978 their undergraduates in Accountancy and Business Administration will sit for the same joint examinations with lky/1977/lky1223a.doc students of the University of Singapore. They will attend the same lectures in the English language given by the same lecturers. They will probably be supervised or tutored by their own respective staff. The target date to get this done for all faculties is 1981.
This is the measure of the totally different political climate of Singapore.
It has taken over 20 turbulent years to have economic imperatives work its way through the passions of language and culture. Only in 1977 – 21 years after Nanyang University was founded, has the self-governing Chinese-educated
Council of Nanyang University reached an unanimous decision to teach in
English. Only the older Ministers understand and sympathise with the dilemma of this group of men. I share their desire to preserve as much of the traditions of Confucian scholarship, values and culture as is possible in Singapore.
English has provided a neutral instrument all racial and dialect groups can learn to use with no unfair bias. English has given us direct access to the knowledge and technology of the industrialised West. Without the continued use of English, Singapore would not have secured a new base for her economy, and brought up to date her role in the international and regional economy. It is the duty of the government to ensure that Nanyang University’s reorganisation lky/1977/lky1223a.doc succeeds. For to do nothing is to see more years of wastage in Nanyang University.
Your responsibility is not simply to pass examinations and get a job. In order that you can do your job and discharge your debt to the community you must have a second and third language capacity. You must feel for your people – those who could not make it to the top. Only that sense of commitment will enable you to carry them with you in the difficult decisions your generation must take before Singapore becomes a totally homogeneous people. Singapore may never be homogeneous in its ethnic composition, perhaps not even in its language use. But we can share one language and one national ethos. We share the same future, and we may as well make the best of it.
-----------------
lky/1977/lky1223a.doc
TABLE 1 PERCENTAGE OF SINGAPORE STUEDNTS RECEIVING HIGHER EDUCATION
Year No admitted to Sec 1 Pri 1 No admitted to Sec 1 Pri 1 19.. % % Year % % Univ. Nan Inst.* Total Year Enrol Year Enrol Ngee Inst ** Total Year Enrol Year Enrol Oversea’s Ann Tech. of yang of Univs. * 19.. a/b 19.. a/c 19.. Poly College of 19.. d/e 19.. d/f S’pore Univ Edun Colleges a b c Edun d e f 70 1390 685 582 71 2728 64 34204 8.0 58 55453 4.9 70 1617 302 316 2235 66 39816 5.6 60 60037 3.7 71 1328 710 207 97 2342 65 34864 6.7 59 59362 3.9 71 2068 336 73 2477 67 39392 6.3 61 55497 4.5 72 1613 888 47 93 2641 66 39816 6.6 60 60037 4.4 72 2512 264 12 2788 68 38837 7.2 62 59056 4.7 73 1692 785 177 216 2870 67 39392 7.3 61 55497 5.2 73 2734 444 1 3179 69 36753 8.6 63 62533 5.1 74 1634 645 118 259 2656 68 38837 6.8 62 59056 4.5 74 2795 649 - 3444 70 38200 9.0 64 63724 5.4 75 1823 829 108 423 3183 69 36753 8.7 63 62533 5.1 75 2475 960 - 3435 71 40557 8.5 65 59130 5.8 76 2006 786 268 538 3598 70 38200 9.4 64 63724 5.6 76 2561 795 24 3380 72 39179 8.6 66 60862 5.6 77 1878 593 201 500 3172 71 40557 7.8 65 59130 5.4 77 2379 765 92 3236 73 46223 7.0 67 58571 5.5 Note: * Entry qual. - GCE ‘A’ Level or H.S.C. ** Entry qual. - GCE ‘O’ Level or S.C.
Trainees whose entry qualifications are Univ. Degrees or Tech. Diploma/ITC are excluded. However, the nos. are as follows:
1970 1971 1972 1973 1974 1975 1976 1977
Univ. Degree 388 203 224 115 94 228 309 290
Tech. Diploma/ITC 7 143 - 32 17 145 36 13
Total 395 346 224 147 111 373 345 303
Statistics for private students studying in countries other than UK, Australia and New Zealand are not available as such students are not required to go through the PSC before proceeding abroad.
lky/1977/lky1223a.doc
TABLE 2
Comparative Percentage of Students Receiving Higher Education
SUMMARY
As % of Sec I As % of Primary 1 (Grade 7) (Grade 1) ---------------- ---------------------- Country Period Univ Tech College Univ Tech College
Singapore 5 yr ave 8.0% 8.3% 5.2% 5.5% (1973-77)
UK/Wales 3 yr ave 9.5% 2.9% 9.5% 2.9% (1969-71)
Japan 6 yr ave 31.0% 0.6% 29.9% 0.6% (1970-75)
USA 6 yr ave 48.2% NA 48.2% NA (1970-75)
lky/1977/lky1223a.doc
TABLE 3
DATA ON EMPLOYMENT PASSES ISSUED TO PROFESSIONALS DURING THE PERIOD FROM 1970 TILL OCTOBER 1977 YEAR 1970 1971 1972 1973 1974 1975 1976 1977 (Jan to Oct) OCCUPATION Engineers 1002 1106 1382 2087 2552 1978 Accountants 88 126 153 196 278 201 Architects 89 90 117 184 210 89 Doctors/Dentists/ 33 72 53 83 338 258 Pharmacists/Chemists Surveyors 37 48 85 95 120 68 Management 49 17 16 16 no no Consultants data data Lawyers 4 7 25 38 41 22 Teaches (Teachers no no 413 774 1191 911 teaching from primary data data school level to university level) TOTAL 4196 5285 1302 1466 2244 3473 4730 3527 Notes: (1) For years 1970 and 1971, there is no data breakdown according to occupational groupings. Also, the two figures 4196 and 5285 include Employment Passes issued to other types of foreigners who do not have tertiary education, eg journalists, nurses, radiographers etc.
(2) For years 1972 and 1973, no separate data is available on teachers.
(3) For years 1976 and 1977, no data is available on the management consultants group. This is because in the programme for computerisation of employment pass data, there is no grouping of management consultants.
a) Education 1 b) Art and Social Science 2 c) Science 10 d) Accountancy 1 e) Law 1 f) Degree in other branches of study 4 ----- Total: 920 ----- lky/1977/lky1223a.doc
TABLE 4
Number of work permit holders with Post-Secondary Education as at 21 Dec 77
Type of Post-Secondary Education
(i) Holder of diplomas, technical or professional certificates 234
(ii) 1st Degree Holders 667 a) Education 16 b) Arts and Social Science 74 c) Science 171 d) Accountancy 25 e) Commerce and Business Administration 72 f) Law 7 g) Engineering 188 h) Architecture 3 i) Surveying 1 j) Building 4 k) Medicine and Surgery 2 l) Pharmacy 8 m) Veterinary Science 6 n) Degree in other branches of study 90 (iii) Higher Degree Holders 19 a) Education 1 b) Art and Social Science 2 c) Science 10 d) Accountancy 1 e) Law 1 f) Degree in other branches of study 4 ------- TOTAL : 920